Ignite Robotics
Turning Scattered Data Into Program Clarity
CONTEXT
At Ignite Robotics, I designed a central dashboard that consolidates program data and speeds up adminitrative tasks.
Ignite Robotics is a robotics organization based in Bellevue where students design, build, and test robots using professional tools with peer mentorship. They compete in the VEX Robotics Competition across three programs: Exothermic (High School), Quantum (High School), and Blaze Qubits (Middle School).
MY ROLE
UX Design Intern
TOOLS
Figma, Miro, Draw.io
TIMELINE
Mar 2025 – Present
TEAM
Kevin Wang, Josephine Li, Vernon Lumpkin
THE PROBLEM
Disconnected Spreadsheets and Systems
The administrative team currently relies heavily on multiple spreadsheets and platforms to organize programs, manage teams, and track various tasks.
THE PROBLEM
Disconnected Spreadsheets and Systems
The administrative team currently relies heavily on multiple spreadsheets and platforms to organize programs, manage teams, and track various tasks.
THE PROBLEM
Disconnected Spreadsheets and Systems
The administrative team currently relies heavily on multiple spreadsheets and platforms to organize programs, manage teams, and track various tasks.
Header

Therefore I asked,
How might we streamline administrative processes and make viewing student information more efficient?
Therefore I asked,
How might we streamline administrative processes and make viewing student information more efficient?
Therefore I asked,
How might we streamline administrative processes and make viewing student information more efficient?
Solution
From Scattered Updates to Real-Time Program Awareness
When progress is fragmented across tools, visibility breaks down. I designed this dashboard as a single source of truth so administrators can quickly understand program performance and decide what to address next.
Solution
From Scattered Updates to Real-Time Program Awareness
When progress is fragmented across tools, visibility breaks down. I designed this dashboard as a single source of truth so administrators can quickly understand program performance and decide what to address next.
Solution
From Scattered Updates to Real-Time Program Awareness
When progress is fragmented across tools, visibility breaks down. I designed this dashboard as a single source of truth so administrators can quickly understand program performance and decide what to address next.
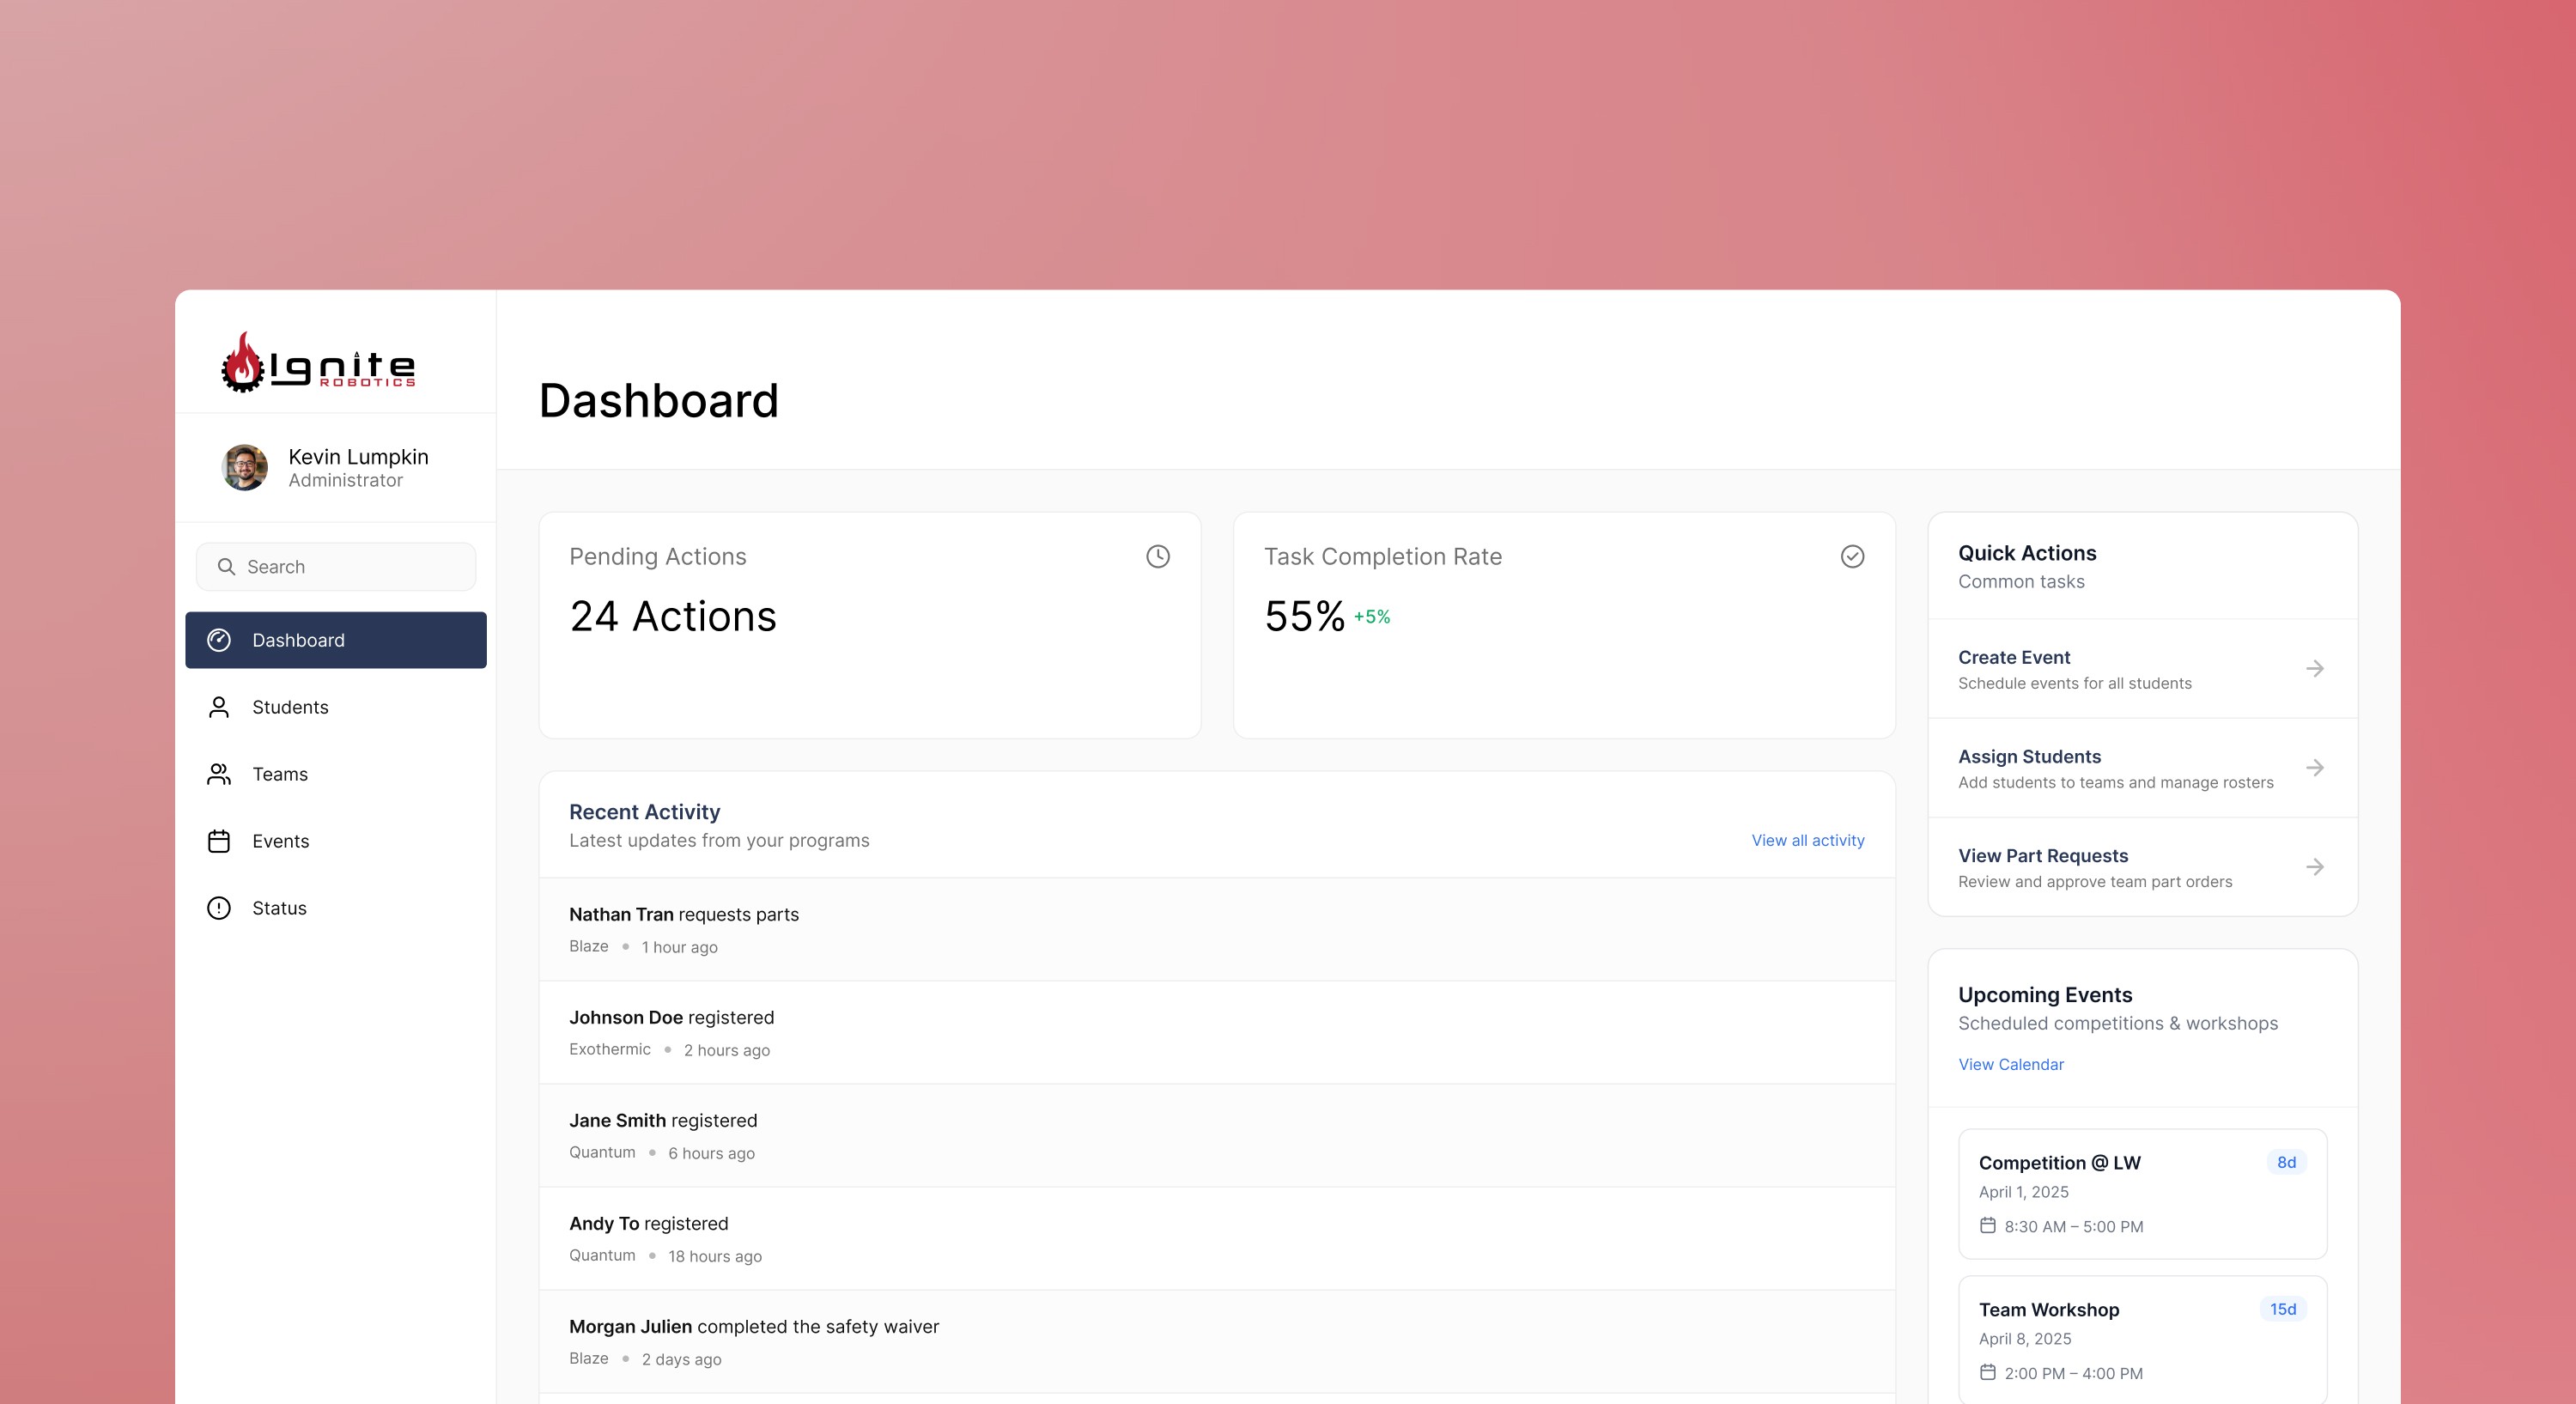
Header

Review Key Updates & Take Action
The dashboard surfaces pending actions, overall progress, and recent activity so administrators can quickly prioritize follow-ups and move work forward.
Review Key Updates & Take Action
The dashboard surfaces pending actions, overall progress, and recent activity so administrators can quickly prioritize follow-ups and move work forward.
Review Key Updates & Take Action
The dashboard surfaces pending actions, overall progress, and recent activity so administrators can quickly prioritize follow-ups and move work forward.
Header

Unlock Insights Across Programs
The dashboard surfaces pending actions, overall progress, and recent activity so administrators can quickly prioritize follow-ups and move work forward.
Unlock Insights Across Programs
The dashboard surfaces pending actions, overall progress, and recent activity so administrators can quickly prioritize follow-ups and move work forward.
Unlock Insights Across Programs
The dashboard surfaces pending actions, overall progress, and recent activity so administrators can quickly prioritize follow-ups and move work forward.
Header

Find Students and Teams That Need Attention
Instead of scrolling through rows of data, administrators can search and filter students and teams by what actually matters, like program, status, and readiness.
Find Students and Teams That Need Attention
Instead of scrolling through rows of data, administrators can search and filter students and teams by what actually matters, like program, status, and readiness.
Find Students and Teams That Need Attention
Instead of scrolling through rows of data, administrators can search and filter students and teams by what actually matters, like program, status, and readiness.
Header

Header
Dig Deeper Into Student and Team Progress
Get a high-level overview of teams and student needs in one place.
Dig Deeper Into Student and Team Progress
Get a high-level overview of teams and student needs in one place.
Dig Deeper Into Student and Team Progress
Get a high-level overview of teams and student needs in one place.
Header

Header
PRIORITIZED USE CASES
Focusing on Key Needs for Efficient Monitoring and Team Organization
PRIORITIZED USE CASES
Focusing on Key Needs for Efficient Monitoring and Team Organization
Use case #1
As an administrator, I want to quickly view the status of student payments, waiver completion, keycard access, and safety quiz results so I can easily identify and follow up with students who still have outstanding tasks.
Use case #2
As an administrator, I want to see relevant data (e.g., age, program enrollment, roles, preferences) so I can create and manage student teams across programs more efficiently and accurately.
Use case #2
As an administrator, I want to see relevant data (e.g., age, program enrollment, roles, preferences) so I can create and manage student teams across programs more efficiently and accurately.
NEXT STEPS
Usability Testing
NEXT STEPS
Usability Testing
Goals
Validate User Experience, Identify Usability Issues, Assess User Satisfaction, Refine Design
Methods
Task-Based Testing, Moderated Sessions, Post-test interviews
Methods
Task-Based Testing, Moderated Sessions, Post-test interviews
SUCCESS METRICS
What Would Make This Dashboard Successful?
Success Metrics
What Would Make This Dashboard Successful?
50% reduction in Time for Team Creation
Aiming for at least a 50% reduction in the time it takes to create and assign teams compared to the previous process.spend less time on manual steps.
100% Visibility
Ensuring that 100% of task statuses are visible, making it easier for administrators to track and follow up on incomplete tasks.
100% Visibility
Ensuring that 100% of task statuses are visible, making it easier for administrators to track and follow up on incomplete tasks.
User Satisfaction
Targeting 80%+ of users to report improved workflow efficiency and satisfaction with the dashboard.
User Satisfaction
Targeting 80%+ of users to report improved workflow efficiency and satisfaction with the dashboard.
MORE PROJECTS


